HEARING TEST
Decoding the Audiogram: Understanding Hearing Test Results
By Team Hearzap | June 18, 2024
There are many ways to wonder if you have hearing loss, and there are many ways to figure it out as well. Some of them might include recurrent feedback from people saying “Turn down your speaker volume”. Or you might have realized that you’ve been saying “What?” followed by “Could you repeat that again?” a bit too frequently to ignore.
But if this sounds too vague to you, there’s a professional way to map your hearing loss—it is called an ‘audiogram’. An audiogram measures your hearing ability and charts it out on a graph so your audiologist can read it and decipher the extent of your hearing loss. Read on to find out how you can read an audiogram.
What is An Audiogram?
An audiogram charts out the results of your audiometry test onto a graph projection for your audiologist to interpret. The test involves the usage of an audiometer which is connected to a pair of headphones, speakers, or a bone-conduction device. The audiometer will emit a series of sounds which travel into your ear through these devices, and measure the response of your ears. Your audiologist will ask you to raise your hand or press a button in response to the sounds that you hear. The results of this test will then be displayed on a screen.
The Audiogram Graph
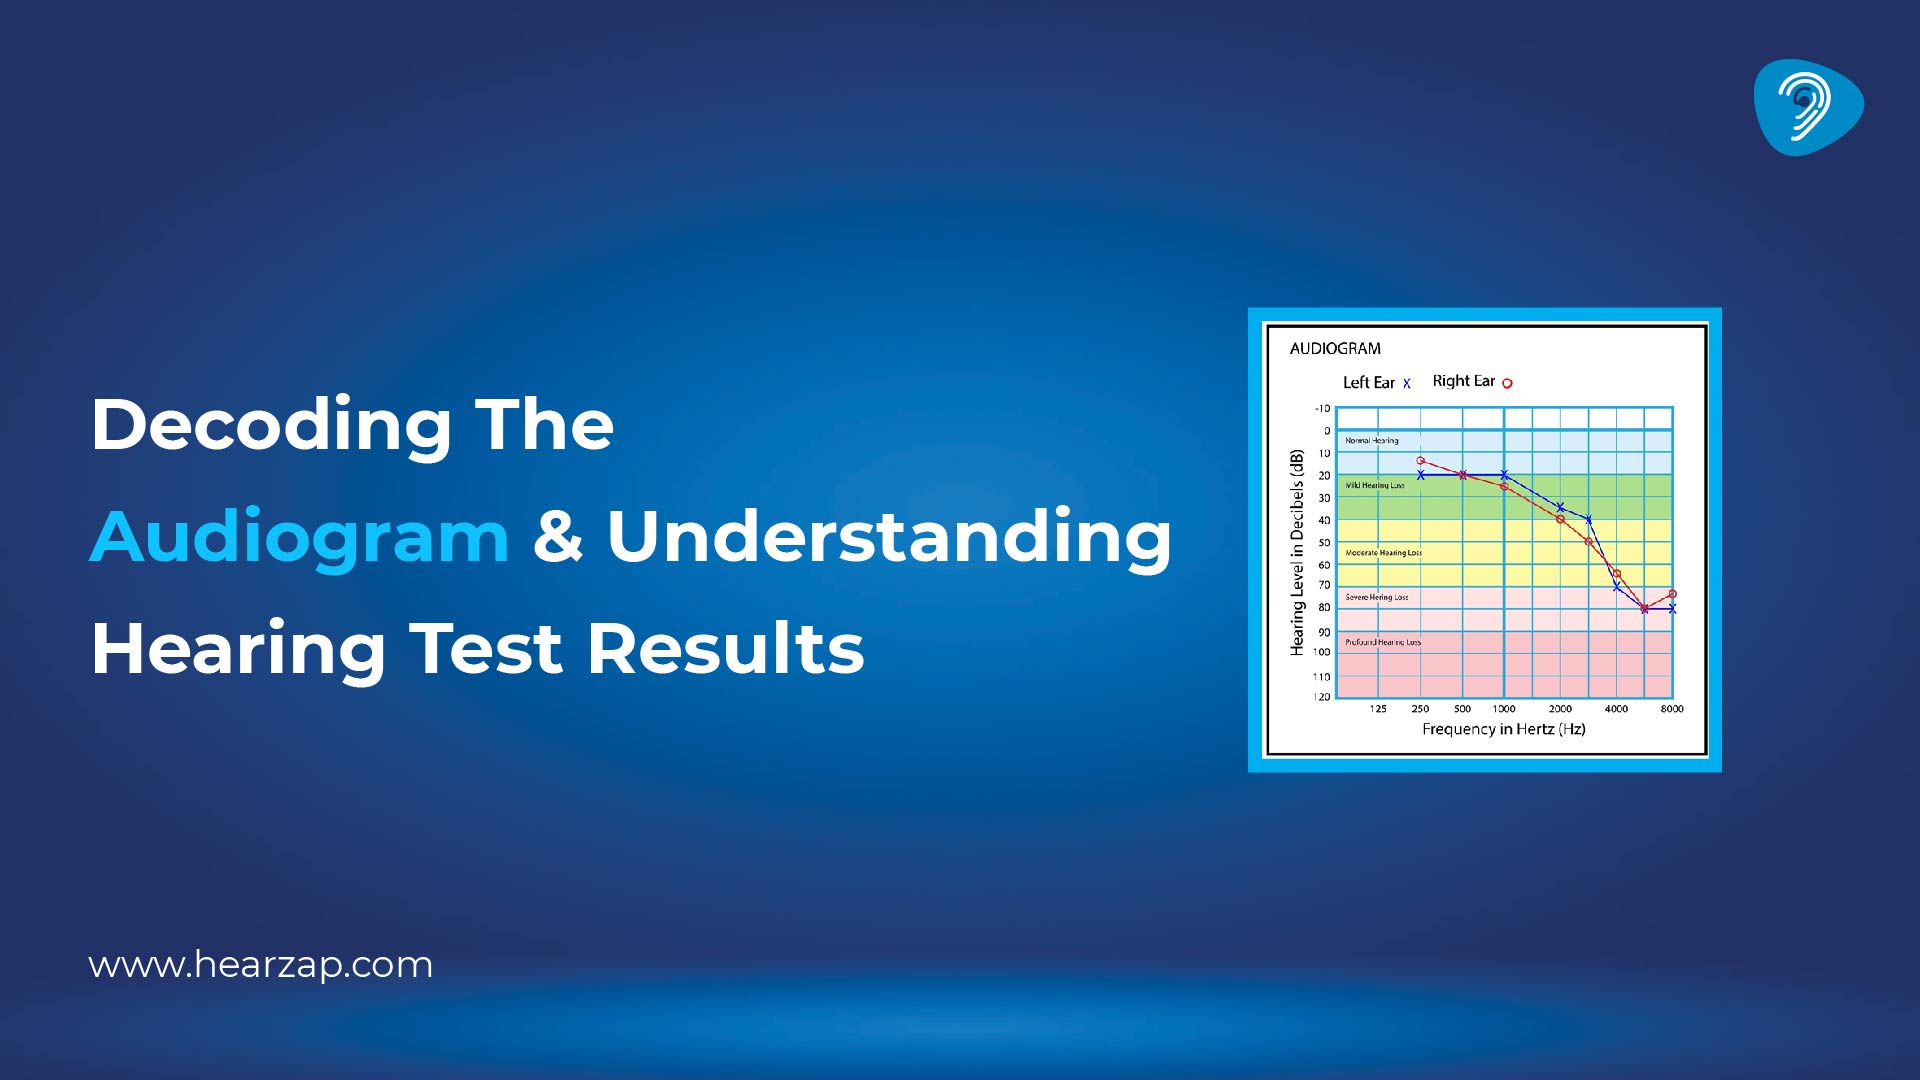
The audiogram is a graph or a visual representation of the results of your hearing test. Let’s take a look at how you read it.
- The Y-axis
The vertical line measures the intensity and loudness of the sound. It is measured in decibels (Db) and it ranges from -10 to 110 on the audiogram. An example of a low-decibel sound is a whisper, whereas the noise from a hair dryer, or a mixer-grinder is classified as a high-decibel sound.
- The X-axis
The horizontal line measures the ‘pitch’ of the sound, also known as ‘frequency’. The numbers range from 125 to 8,000 and are measured in hertz (Hz). Some examples of low-frequency sounds are ocean waves and wind turbines. Some examples of High-frequency sounds are the sounds that mosquitoes make and whistles
The normal range for an audiogram ranges from 0 to 25 decibels. If your audiometry test charts your hearing range between 250 to 8000 Hertz, it shows that your hearing range is normal.
In Conclusion …
The audiologist is the right person to approach to decipher your results since you cannot read them all yourself (Shocker! As if you didn’t know! … anyway …) Just know that you can feel free to approach your audiologist with all your questions on your next visit to Hearzap. See you soon! Happy hearing!
Related Blogs
What is a Tone Decay Test? How It Detects Hidden Hearing Loss

5 Reasons Why You Should Get a Hearing Test

When Should You Consult An Audiologist?
Contact us
We are here for all your hearing needs, from hearing tests to hearing aids. Fill out the form below, and we will give you a call soon.
Recent Blogs
By Team Hearzap | July 18, 2025
By Team Hearzap | July 17, 2025
By Team Hearzap | July 15, 2025
By Team Hearzap | July 14, 2025
By Team Hearzap | July 11, 2025